데이터분석 및 인공지능/밑바닥부터 시작하는 딥러닝
밑바닥부터 시작하는 딥러닝-(2)
백수진
2021. 9. 17. 02:28
matplotlib
딥러닝에서는 그래프와 데이터를 시각화가 중요하며 그래프를 그려주는 라이브러리인 matplotlib에 대해서 알아보자.
1. matplotlib.pyplot as plt
matplotlib의 pyplot class를 plt로 정의해서 class에 정의된 메소드들을 활용하면서 그래프를 그릴 수 있음.
# pyplot을 사용한 그래프그리기

import numpy as np
import matplotlib.pyplot as plt

x = np.arange(0,6,0.1)
y = np.sin(x)

plt.plot(x,y)
plt.show()
2. pyplot의 기능
*label을 통한 해당하는 부분에 대한 이름을 넣어줌
*plt.plot(x축의 범위가 지정된 변수, y의 함수가 지정된 변수)
*plt.legend()를 통한 왼쪽위를 1로 맞추고 plt.show()를 통한 그래프 그리기
등을 주된 기능으로 볼 수 있음
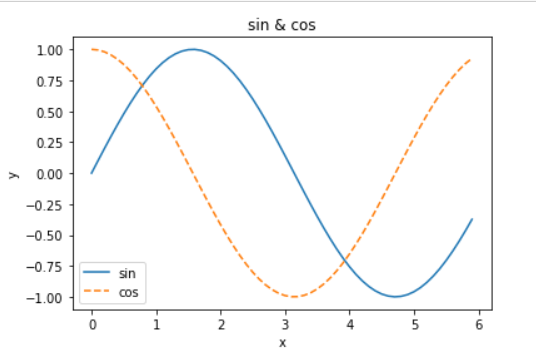
# pyplot의 기능
import numpy as np
import matplotlib.pyplot as plt

x = np.arange(0,6,0.1)
y1 = np.sin(x)
y2 = np.cos(x)

plt.plot(x,y1,label = "sin")
plt.plot(x,y2,linestyle="--",label = "cos")
plt.xlabel("x")
plt.ylabel("y")
plt.title("sin & cos")
plt.legend() # plt의 왼쪽위를 1에 맞춰주는 기능
plt.show()